User Guide Page
Discover all the powerful tools our website offers to help you succeed.
1. Data Management
Configure Unit of Measure (UoM): Set up the standardized units (e.g., Cups, Units) used across all product orders and inventory calculations.
Product Category Setup: Define and establish the product categories required for the proper creation and organization of products.

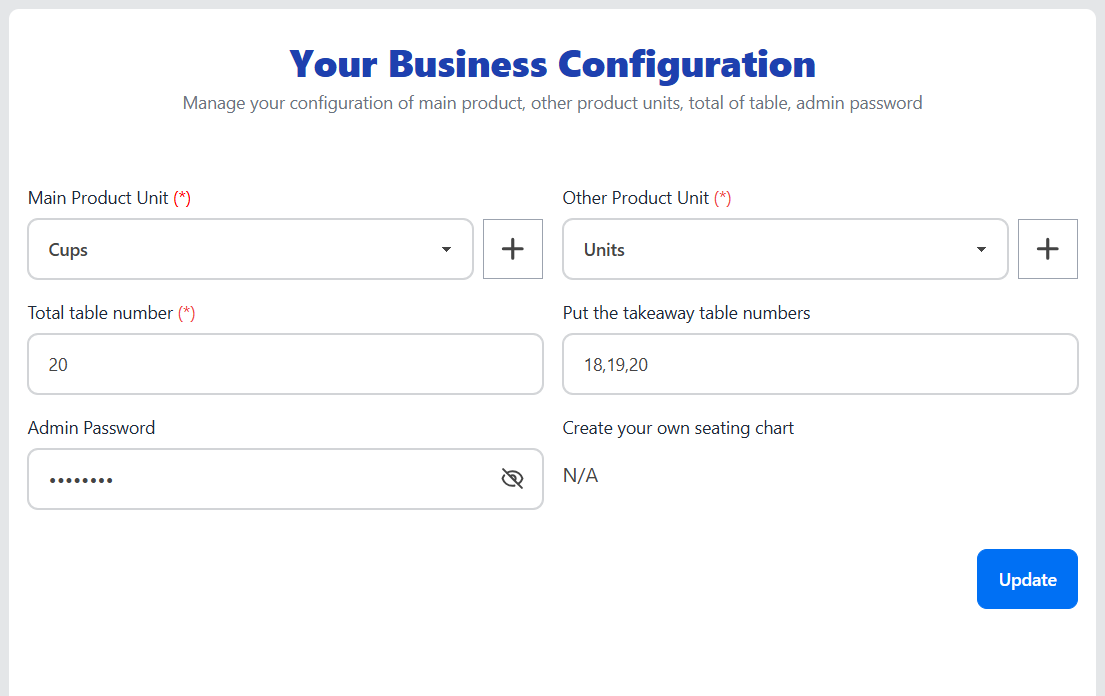
2. Configuration
This is ideal for a configuration form or a step-by-step guide.
- Unit of Measure (UoM) for Main products
- Unit of Measure (UoM) for Other products
- Total Number of Dinning Tables
- Number of Takeaway Tables
- Administrator Password
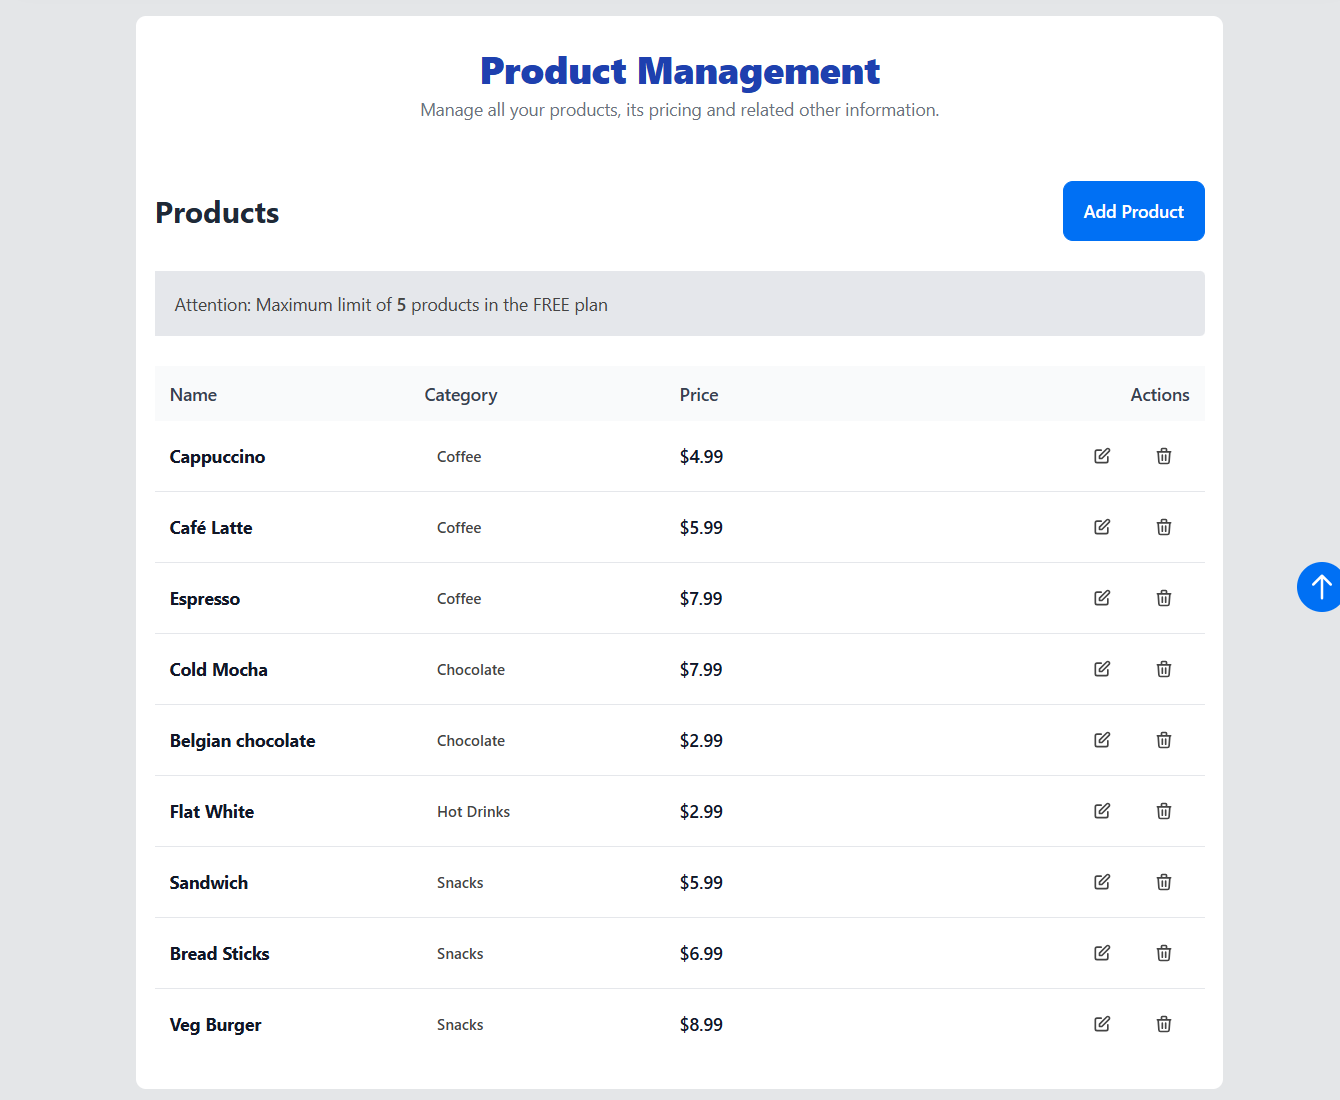
3. Products
Design the items for your shop's menu, including the name, price, all relevant ordering details for each item.
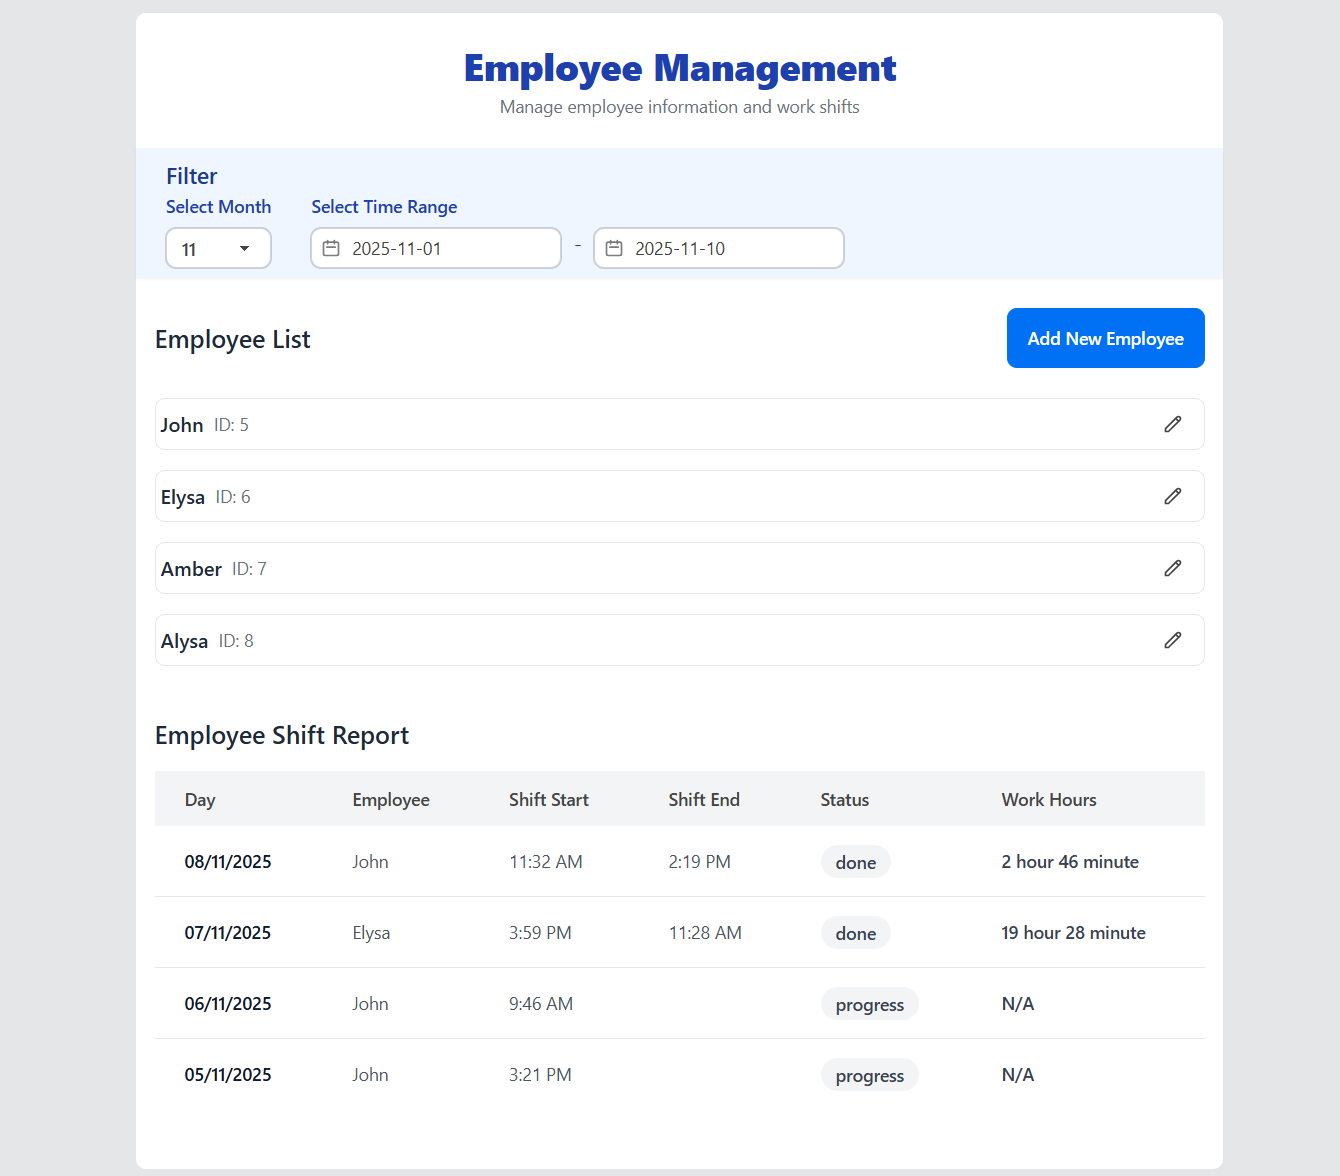
4. Staffs
Employee Management: Implement full functionality for managing all shop employees (e.g., profiles, roles, and status).
Handover Management: Enable the designation and management of employee handovers during a specified period of transition (e.g., shift changes, leave of absence).
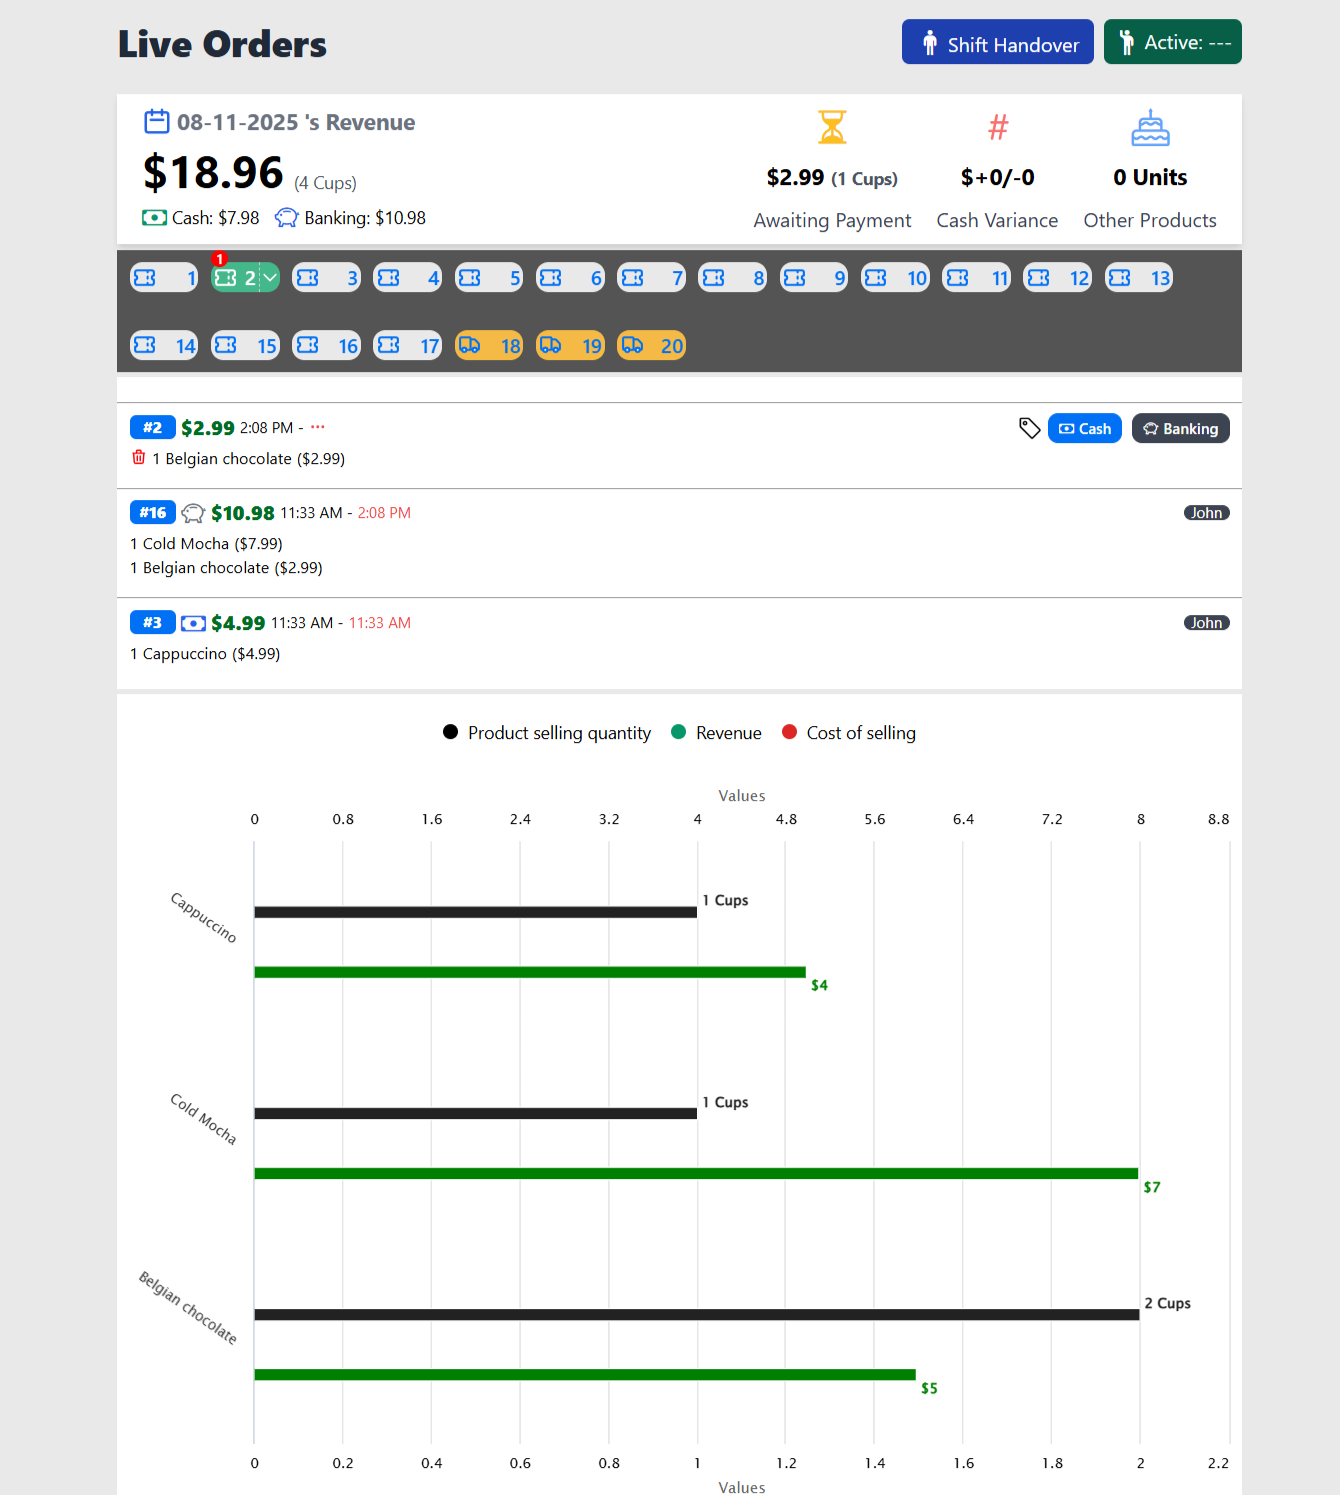
5. Order Management
This is the most critical page in our system. It serves as the primary operational hub, enabling key functions such as:
- Order Processing (Making Orders)
- Daily Reporting (Sales and Order Summaries)
- Shift Management (Changeovers)
- Payment Handling
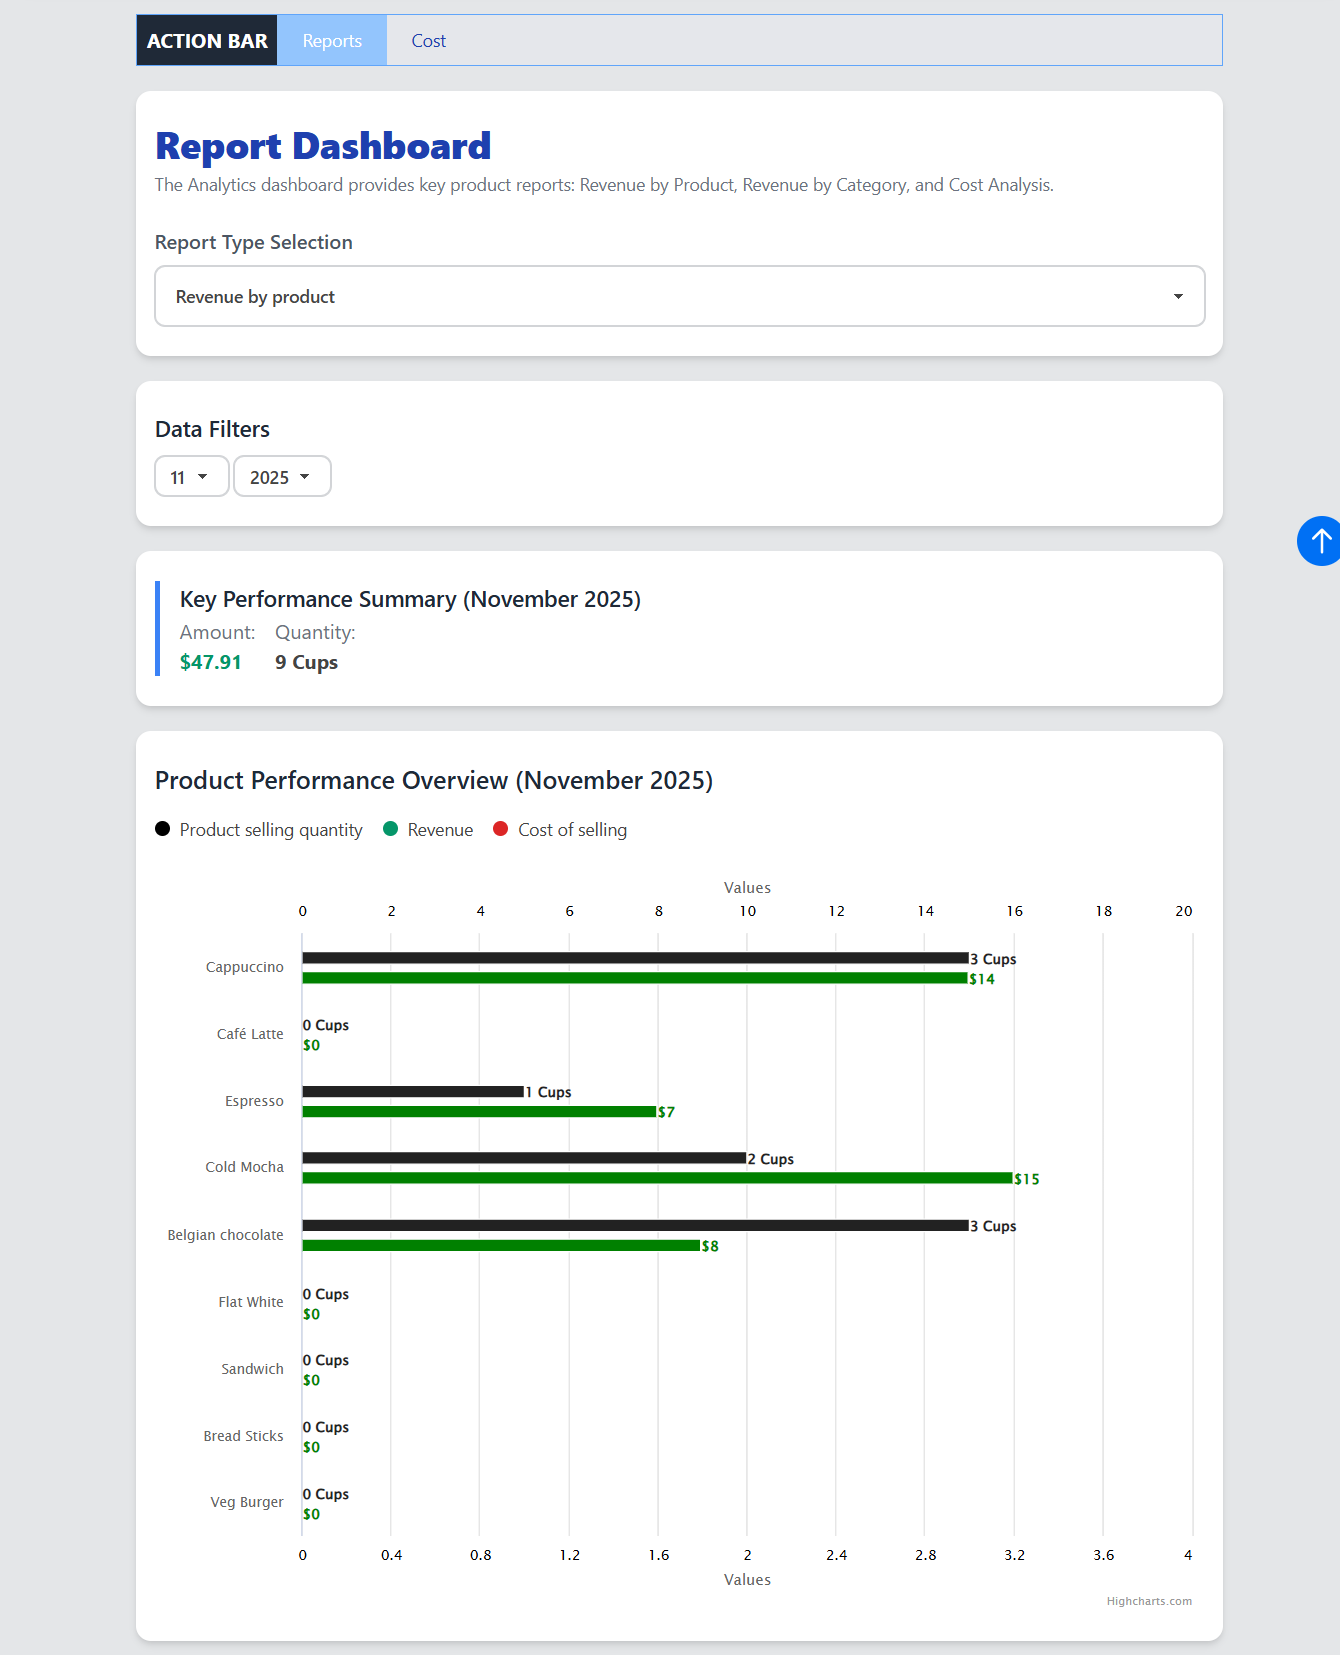
6. Reports
The Report Analytics page provides real-time and historical sales data over time. You can access various reports here to measure your operational efficiency, identify key risks and impediments, highlight strong points, and make informed decisions for strategic changes and improvements. Here is a revised report list:
- Product Sales Performance: Sales volume and revenue by individual product over time.
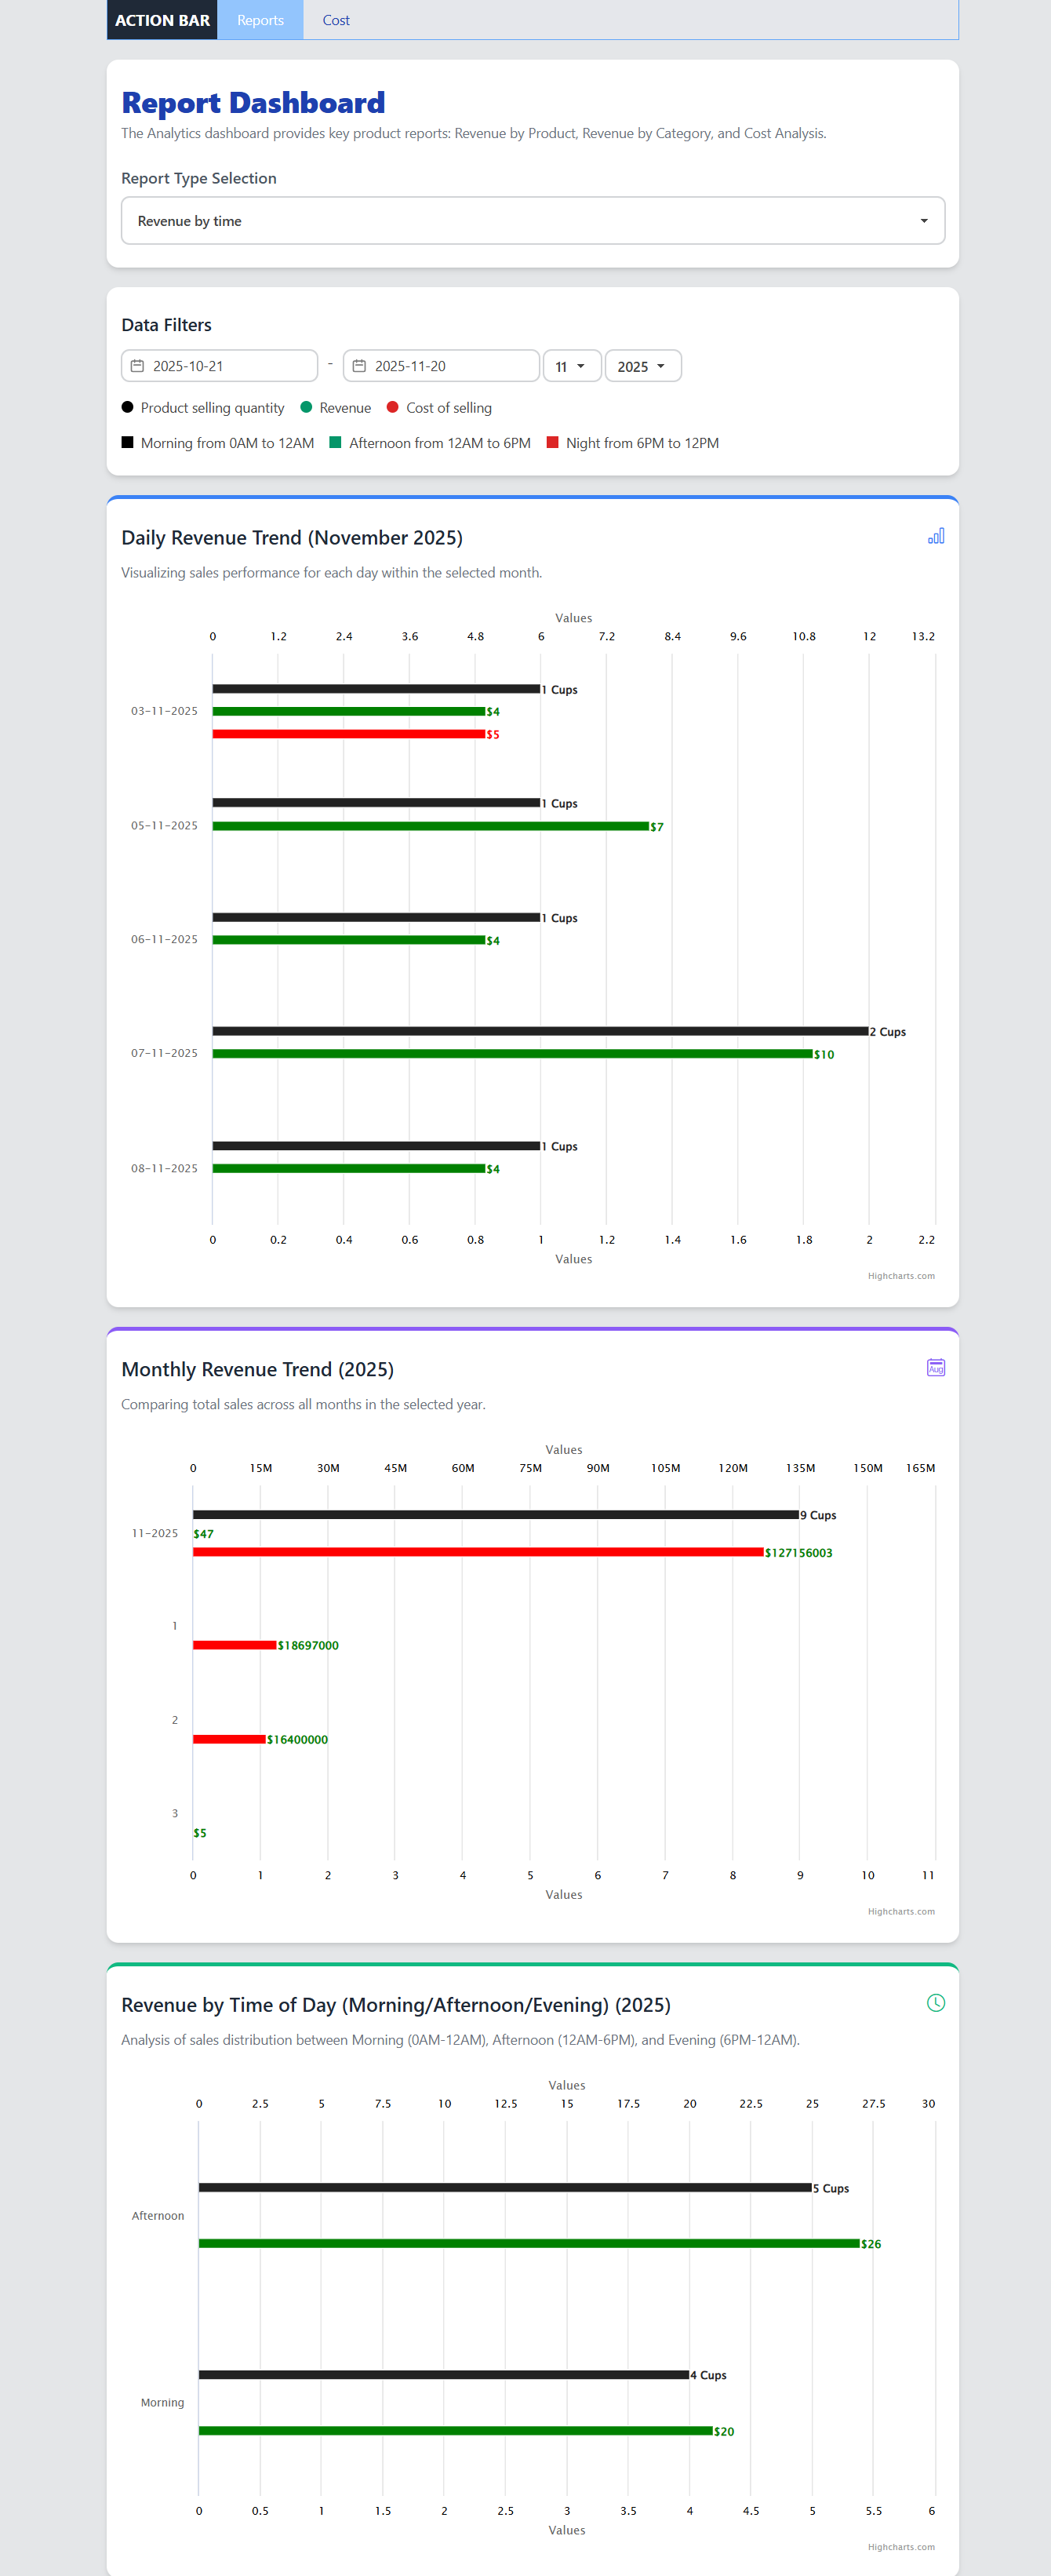
- Monthly Daily Sales: Total sales volume and revenue by day for a selected month.
- Annual Monthly Sales: Total sales volume and revenue by month for a selected year.
- Time-of-Day Sales Analysis: Total sales volume and revenue segmented by specific time periods (e.g., Morning, Afternoon, Evening).